New Publication: Vowel Acoustics as Predictors of Speech Intelligibility in Dysarthria
Hello, world!
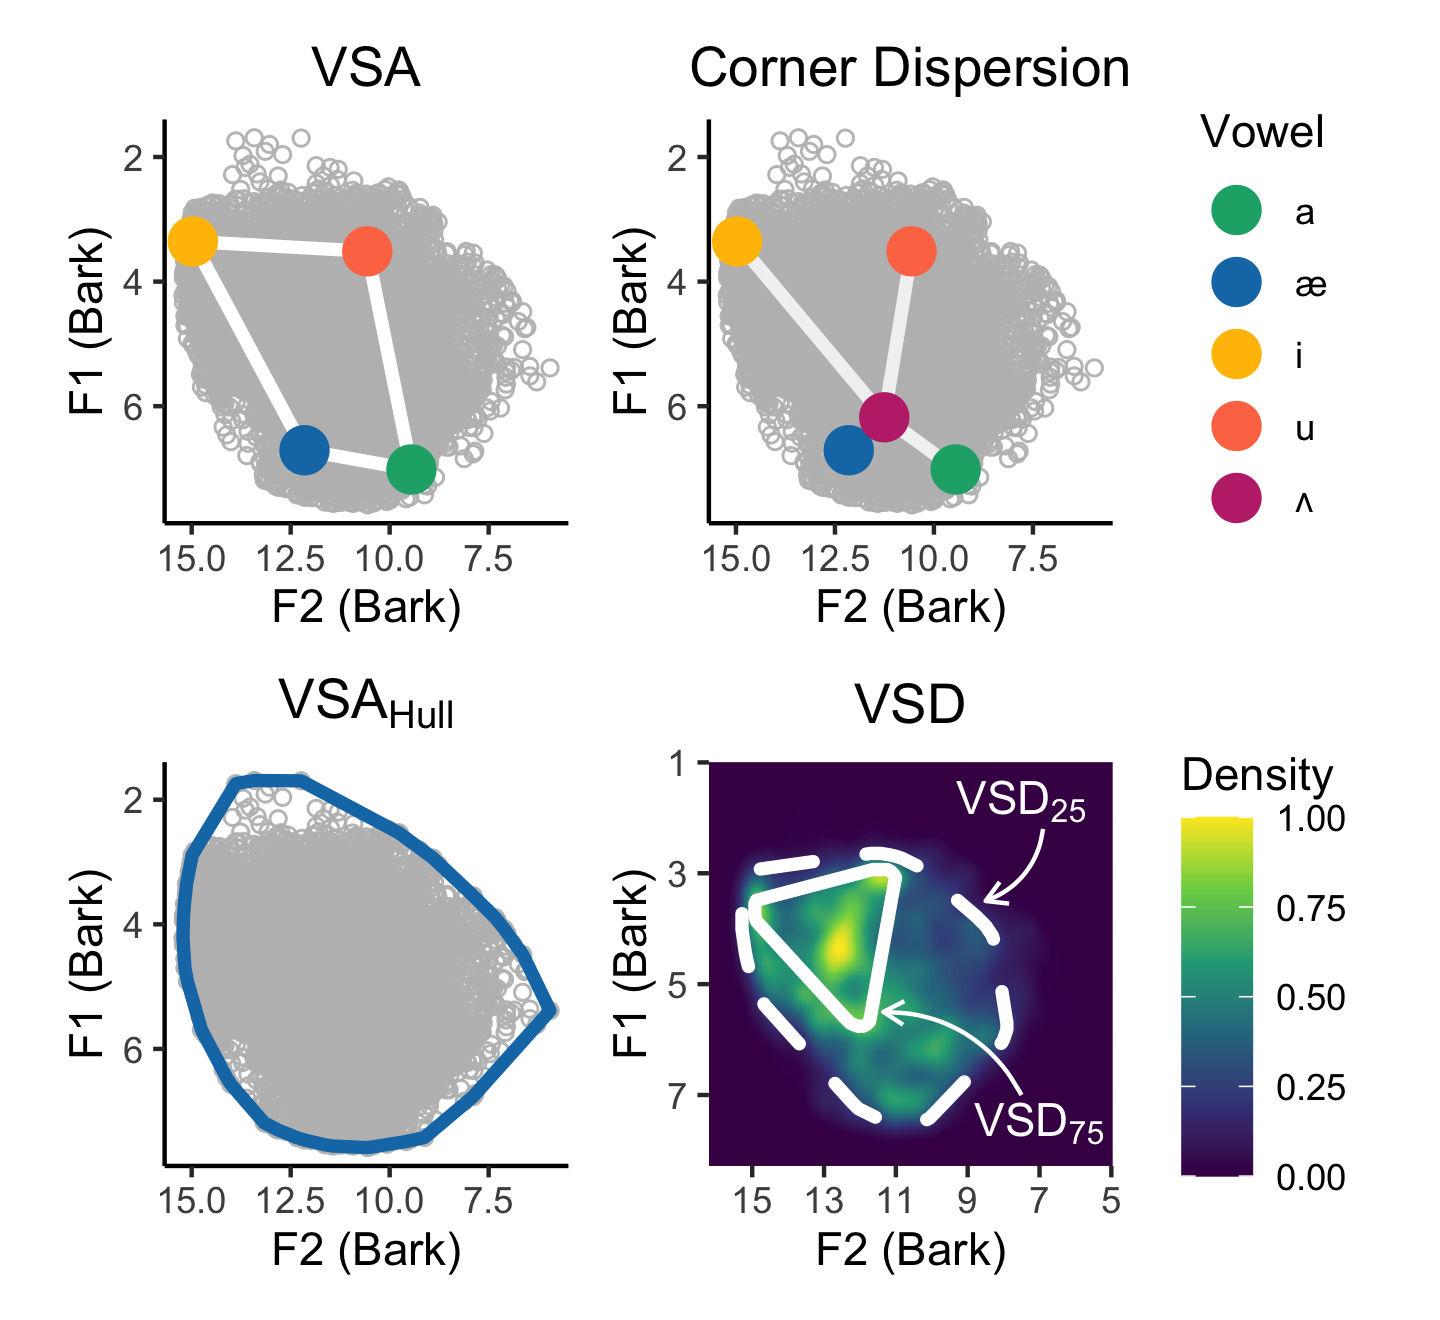
This week, my coauthors and I published a new study titled “Vowel Acoustics as Predictors of Speech Intelligibility in Dysarthria” in the Journal of Speech-Language and Hearing Research as a special issue of select papers from the 2022 Conference on Motor Speech. The purpose of this study was to determine if alternative vowel space area (VSA) measures (i.e., novel trajectory-based measures: vowel space hull area and vowel space density) predicted speech intelligibility to the same extent as two traditional vowel measures (i.e., token-based measures: VSA and corner dispersion) in speakers with dysarthria.
I’ve been dreaming of doing this project ever since I read Whitefield and Mehta’s (2019) study examining various vowel space measures, including vowel space density, in speakers with Parkinson’s disease. I instantly fell in love with this measure and wanted to explore using it in my research, which led to the development of this project.
Highlights
My favorite part about this project was calculating the various vowel space measures (i.e., vowel space area, hull, and vowel space density) and visualizing them using ggplot2 in R. In particular, I thoroughly enjoyed making this plot shown below (making figures tends to be my favorite part of research).
Challenges
The most challenging part of this project was cleaning the raw formant data. To calculate these measures, we want to obtain formant data from the vowel data alone (i.e., removing consonant frequency data and formant tracking errors). In the project, we ultimately used filtering methods that were reported in the previous literature. However, during this process, it became clear that this data cleaning process may have some flaws. For example, for some speakers, this data cleaning process erroneously removed data that appeared to reflect true vowel formant data. In other cases, it retained outlying data that were caused by formant tracking errors or consonant/fricative data. I believe that there may be a better, more nuanced way to clean the data. I hope to tackle this issue in some of my future work.
Thanks for reading. The study can be found here, the preprint can be found here, and the analysis script for the project can be found here. Any and all feedback is welcomed!